What Is Your Home Really Worth? The Limits of Algorithms in North Shore Real Estate.
If you own a home on Chicago’s North Shore, you have likely wondered what it is worth in today's market. Perhaps you have checked an online estimate, noticed a neighbor's house selling for more than expected, or watched headlines about rising Chicago area home prices and started calculating your own equity.
Those are all decent starting points. However, none of them can tell you what your home is actually worth today.
The Headline Fallacy: Why There Is No Single North Shore Market
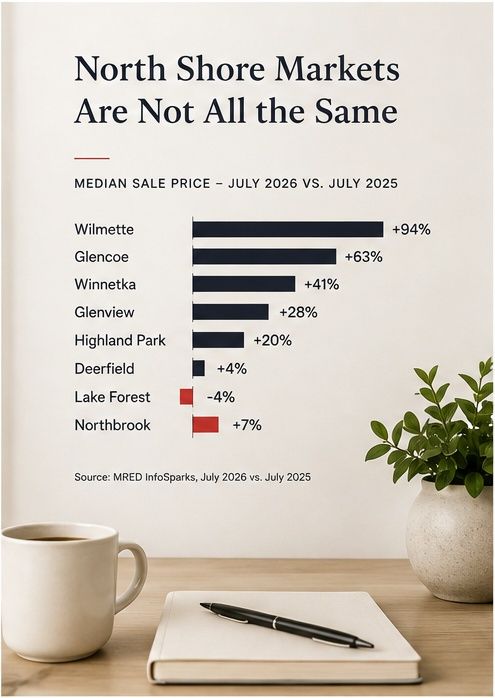
According to the S&P Cotality Case-Shiller Index, Chicago area home prices rose 6.9% year over year as of May 2026. While this broad index shows market direction, it does not mean your specific home is worth 6.9% more than last year. All of our North Shore and Northern Suburbs behave very differently, even when they are located only a few miles apart, as shown by July 2026 data from MRED InfoSparks. Consider the median sale prices from July 2026 compared with July 2025 across these neighboring towns:
- Deerfield: $714,018, up 4%
- Glencoe: $2,200,000, up 63%
- Glenview: $818,000, up 28%
- Highland Park: $930,000, up 20%
- Lake Forest: $1,222,000, down 4%
- Northbrook: $731,000, up 7%
- Wilmette: $1,568,000, up 94%
- Winnetka: $2,437,125, up 41%
These statistics demonstrate why raw market data requires deep context. Did Wilmette homes actually double in value over a single year? No. Did every homeowner in Lake Forest lose 4% of their home equity? No.
A median sale price tells us about the specific mix of homes that closed during a particular period. If a higher concentration of high-end, luxury properties closed this July compared to last July, the median sale price will rise substantially even if individual home values did not change at all. The reverse is also true: if the mix of sold homes shifts toward lower price points, the median drops.
This statistical variation is especially prominent in communities where the total number of monthly transactions is relatively small. For example, in July 2026, only 18 homes closed in Glencoe and only 19 closed in Winnetka. With such small sample sizes, just one or two exceptionally high-end sales can skew the townwide median dramatically. The data is highly useful, but the interpretation is what actually matters.
How Automated Valuation Models Work (And Where They Fail)
Automated Valuation Models (AVMs), the technology behind instant online estimates on sites like Zillow and Redfin, calculate home equity using public records, tax filings, and automated algorithms. Built for massive scale rather than local precision, these algorithms rely on broad averages rather than your individual home's specific characteristics. This broad approach fails on the North Shore and in the Northern Suburbs, where real estate values shift from one block to the next.
The fundamental problem is simple: an algorithm has never walked through your front door. It cannot evaluate your home the way a real human does. Computer algorithms are completely blind to several critical factors that drive value in our local market:
- Micro-Location Dynamics: An algorithm evaluates two homes with identical square footage in the exact same zip code as equal. It cannot distinguish between a home situated on a busy local thoroughfare and one tucked away in a quiet, highly desirable enclave like Colony Point or Deer Run in Deerfield.
- Interior Updates and Quality: Computer models cannot step inside to inspect your property. They do not know whether your kitchen was completely renovated last year with premium custom cabinetry or has not been touched since the 1990s. They cannot calculate the added value of luxury bath renovations or high-end architectural finishes.
- Floor Plan and Layout functionality: An algorithm reads the basic number of bedrooms and bathrooms, but it does not understand the flow of a home. It cannot distinguish between an expanded, open floor plan that modern buyers are actively seeking and a highly compartmentalized layout that feels dated and restrictive.
- The Lot and Surrounding Competition: An online estimator does not evaluate your backyard, your lot placement, or how your home stacks up against the active competition that buyers are viewing on the exact same day.
These are not minor details; they are the exact factors that determine whether a home sells at full asking price in a week or sits on the market for months, requiring multiple price reductions.
Crucial Metrics: Inventory, Days on Market, and List-to-Sale Ratios
To truly understand local real estate value, we need to look at a combination of advanced market metrics that automated algorithms ignore. Three of the most telling metrics are inventory levels, days on market, and list-to-sale ratios.
Months Supply of Inventory: Your home's value is always influenced by the active competition. In July 2026, the months supply of inventory across the North Shore remained tight, ranging from 2.2 months in Winnetka and 2.3 months in Wilmette to 3.3 months in both Highland Park and Deerfield.
These inventory trends are far from uniform. Months supply increased 75% in Deerfield, 59% in Northbrook, and 39% in Lake Forest, while Winnetka's supply declined 31%. New listing activity also varied: Deerfield had 60 new listings (up 42.9%), Highland Park had 59 new listings (up 7.3%), Wilmette had 35 listings (down 35.2%), and Winnetka had 23 listings (up 53.3%). This inventory acts as direct competition for your home.
Days on Market: This metric tracks how quickly buyers are responding to listings. Fewer days on market signals intense buyer demand relative to the available inventory, while rising days on market suggests buyers are taking their time, pricing is slightly off, or growing inventory is giving them more options. For example, homes in Highland Park closed in a median of just 8 days in July 2026, while Northbrook saw its days on market rise to 16 days, indicating a slightly more selective pace.
List-to-Sale Ratio: This ratio compares the final sale price of a home to its last list price, it does not take into account any price reductions. A ratio at or above 100% shows that sellers are pricing accurately and buyers are willing to pay asking price. Across our local communities, these ratios were remarkably high in July 2026:
- Deerfield: 100%
- Glencoe: 101.8%
- Glenview: 101.9%
- Highland Park: 100.3%
- Lake Forest: 100%
- Northbrook: 101.5%
- Wilmette: 100%
- Winnetka: 101.8%
This list-to-sale metric compares the eventual sale price with the last list price, meaning a home may have been reduced before selling. However, properties priced appropriately from the beginning generate enough interest to sell at or above asking. These figures also represent every sale in that town in July. It does not differentiate between price brackets. High-end luxury homes are not selling substantially over asking price, the way homes below 1.5 million are. This is where an experienced real estate advisor can really help guide you.

Determining True Market Value: The Professional Approach
Because automated algorithms skip these nuances, determining the true value of your home requires a strategic, data-driven approach combined with local human expertise. A professional market evaluation involves:
- A Physical Walkthrough: Assessing your home's physical condition, updates, architectural integrity, and floor plan flow.
- Hyper-Local Comparable Analysis: Evaluating recently closed sales in your immediate neighborhood over the past 6 to 12 months, with careful adjustments for school district boundaries and lot positions.
- Pre-Market Sensitivity Testing: Leveraging exclusive private networks, such as the MLS Private Listing Network (PLN) and the Top Agent Network (TAN), to gauge pricing sensitivity and generate early buyer interest before a home ever goes public.
- Forward-Looking Strategy: Establishing a pricing strategy based on where the market is heading and what inventory you will be competing against, not just where the market has been.
Frequently Asked Questions
Is an online estimate ever accurate?
Online estimates can be relatively accurate in subdivisions with highly uniform homes or in condo buildings with similar floor plans where there have been a high volume of recent sales. However, in North Shore markets characterized by diverse home styles, varying ages of renovations, and unique lot placements, the algorithm's margin of error tends to be much larger.
How much can an automated estimate be off by?
The margin of error varies widely by individual property and neighborhood. Because there is no single verified percentage error for North Shore properties, it is far better to compare your online estimate directly against a professional market analysis to see where the algorithm is missing the mark.
The Bottom Line
Online estimation tools are a fun and easy starting point for casual curiosity. But they are no substitute for a real, personalized market analysis grounded in the physical reality of your property and the hyper-local data of your neighborhood.
You do not need to be ready to put a sign in your yard to have this conversation. Knowing your home's actual market value is simply useful financial information. It can help you evaluate your home equity, plan future renovations, or understand what your options might look like if you eventually decide to make a move.
If you are curious about where your home stands in today's active North Shore or North Suburban market, I am always happy to look at the local data, analyze the current competition, and provide you with a thoughtful, no-pressure assessment.
HELPING YOU MOVE FORWARD®
Categories
Recent Posts